Tags
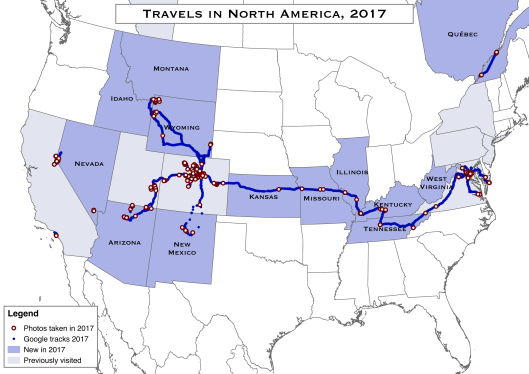
No prizes for guessing which city I have to be in, and which city I want to be in! A special mention to Montreal for (just) taking me outside of UK & US!
My 2017 flights, slightly transparent pen so that repeated routes stand out.
14 Sunday Jan 2018
Posted in Data visualisation, Geo data
Tags
No prizes for guessing which city I have to be in, and which city I want to be in! A special mention to Montreal for (just) taking me outside of UK & US!
My 2017 flights, slightly transparent pen so that repeated routes stand out.
30 Saturday Dec 2017
Posted in Geo data
15 Sunday Jan 2017
Posted in Data visualisation, Geo data
Tags
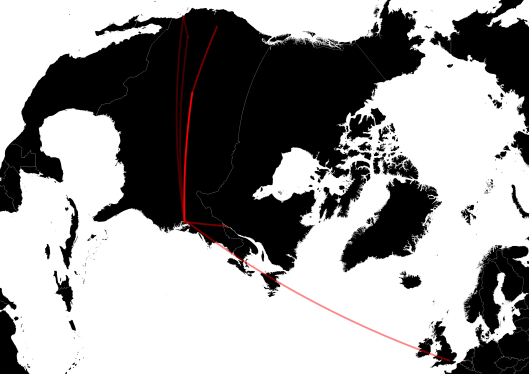
After years of deliberation, months of data wrangling and several reviews by family, I have finally finished version 1 of the jamesgeo well-travelled map. This map aims to answer the question “how well travelled am I?”. Unsurprisingly the answer is not very.
The map is made by taking every point that I’ve been to on the Earth’s surface and buffering by 100 km, without letting this cross any international borders, unless I did. I have chosen 100 km as I argue that culture, geography, geology etc changes significantly over about this distance.

Well-travelled map, showing the Earth’s surface that I’ve experienced.

Well-travelled map, without the context, paints a somewhat dismal view.
26 Monday Dec 2016
Posted in Geo data
Tags
Whilst zooming in to check the data quality on the inputs to my ‘well-travelled’ map I realised that the data made a nice summary of my time in the American West. This made me want to buy a GPS logger for my SLR. Maybe Father Christmas will bring me one next year.
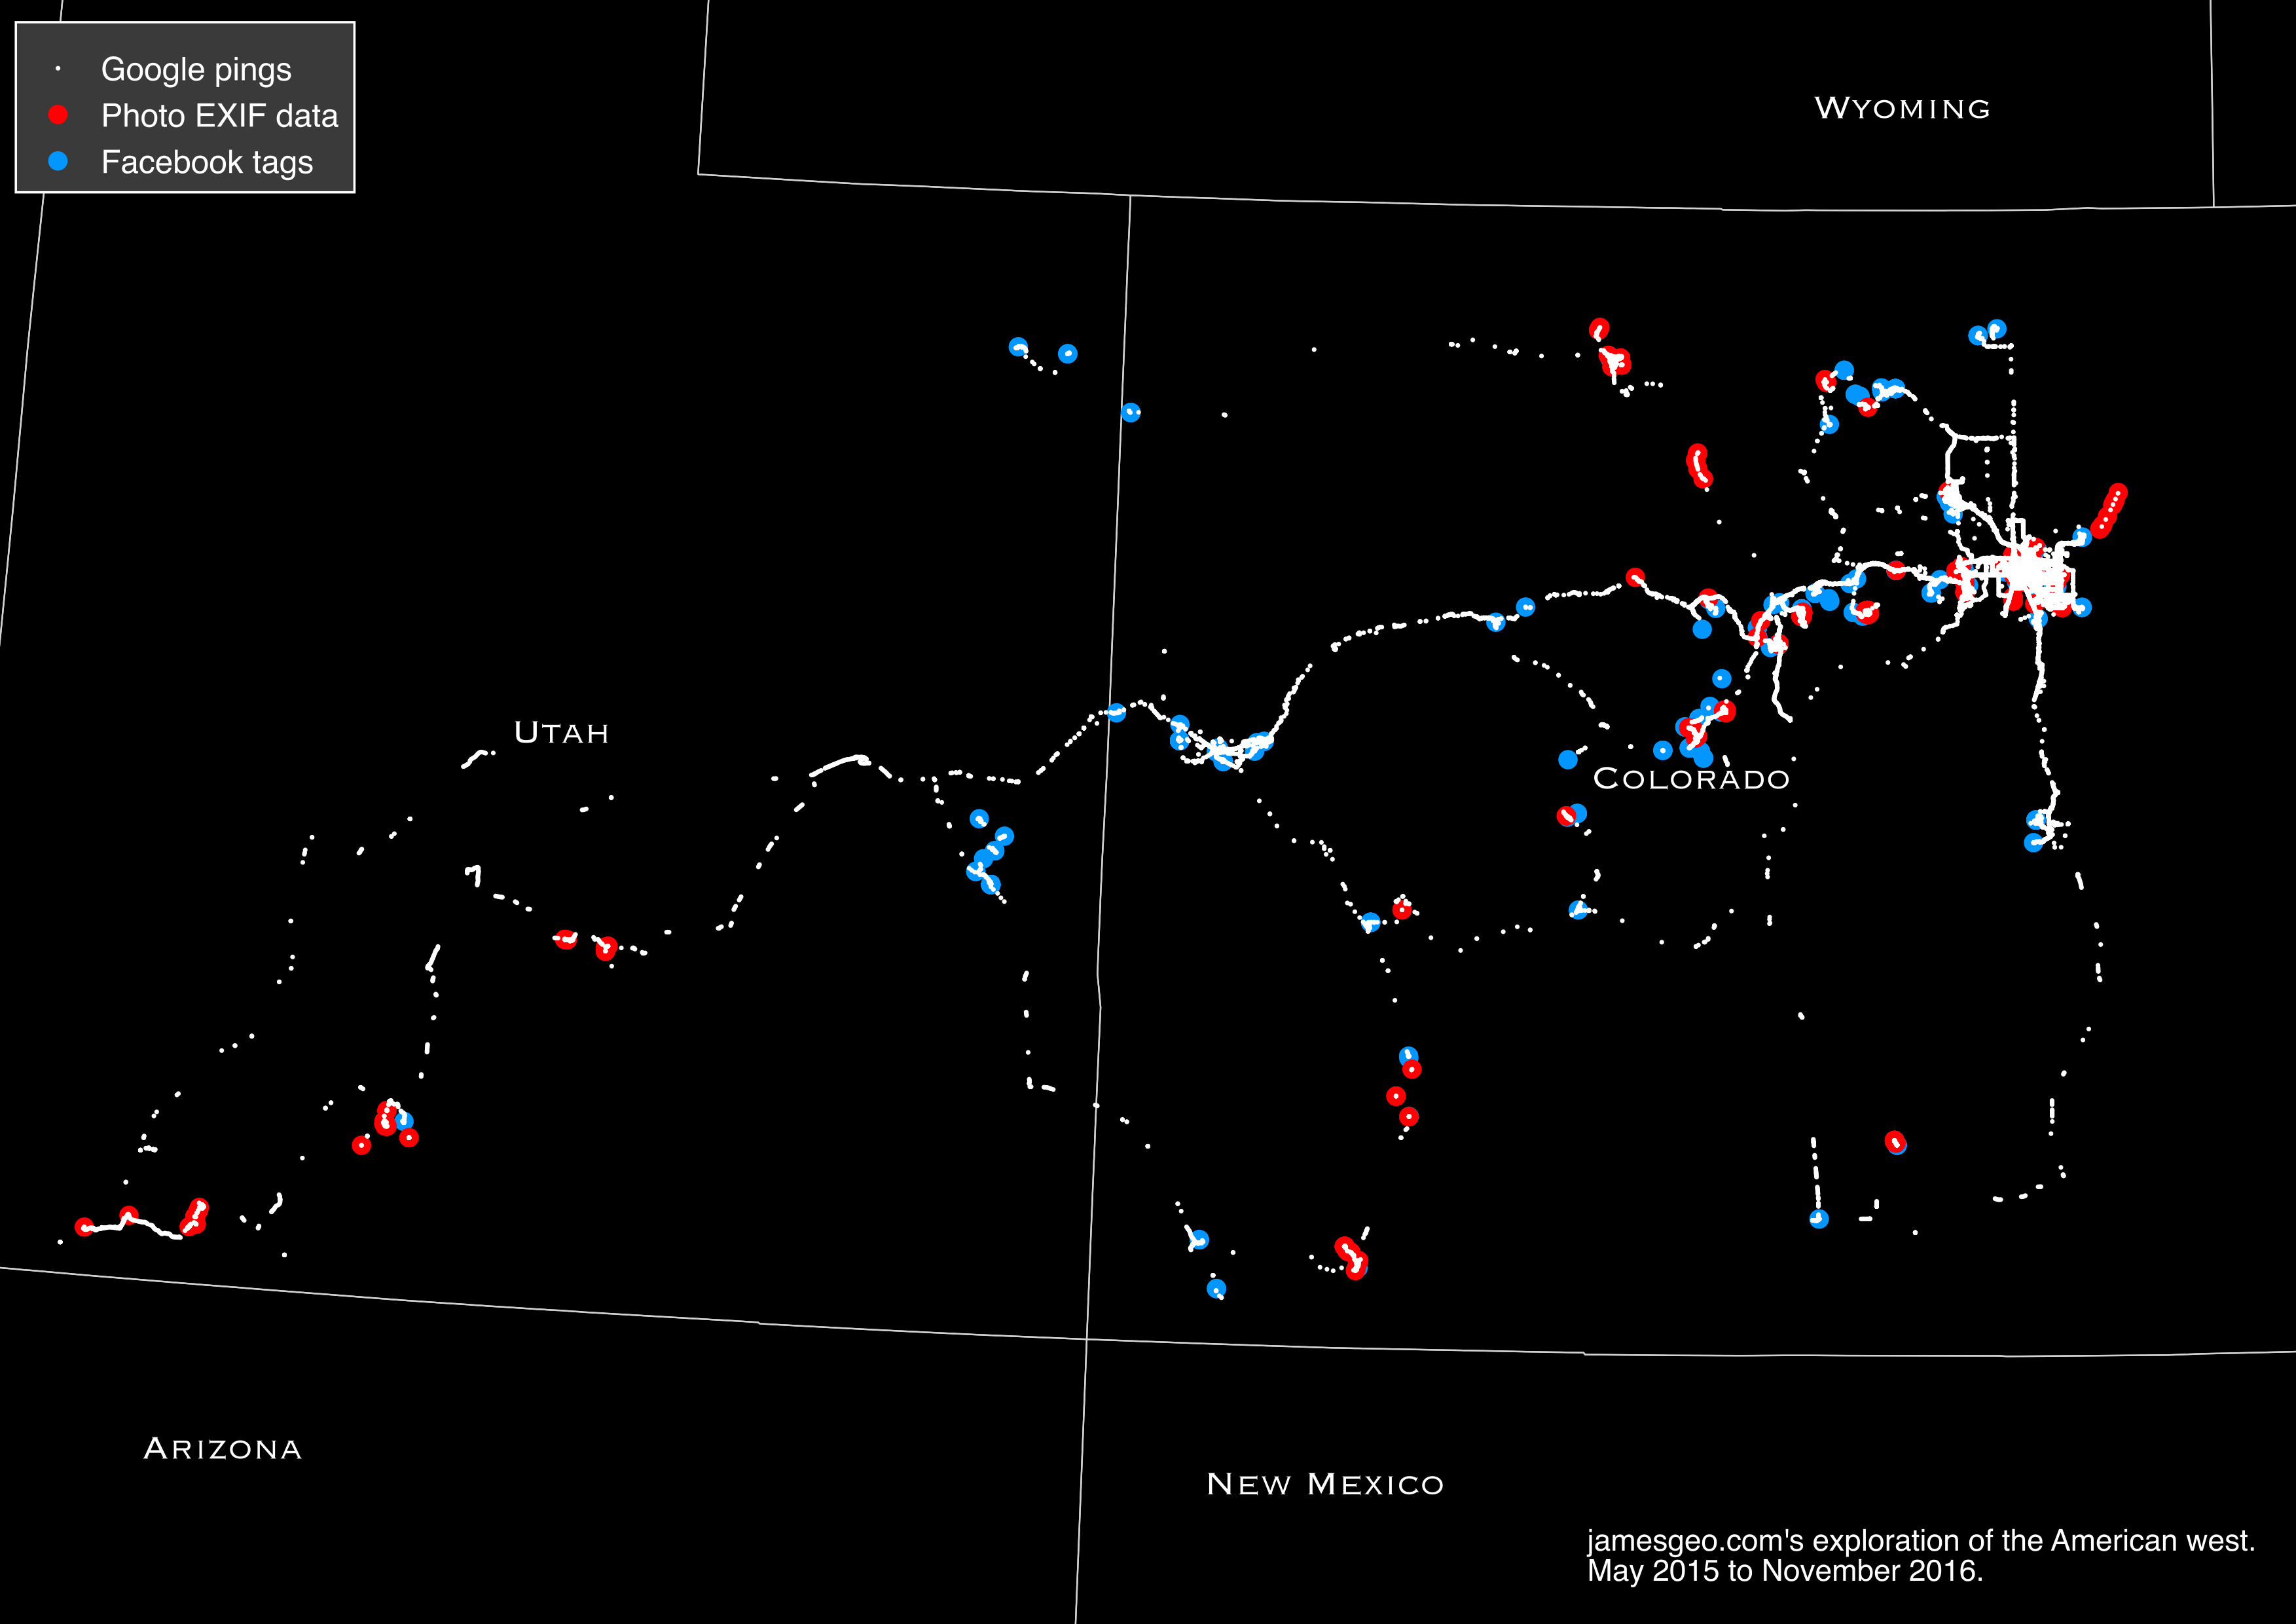
My explorations of the American West.
19 Monday Dec 2016
Posted in Geo data
Tags
I have finally finished amassing data for my well-travelled map, a map that’s going to illustrate how little of the world I’ve actually seen. The four (so far) input layers are shown below. All were automatically produced, apart from the legacy routes.

Inputs to my ‘well-travelled’ map and calculation
28 Monday Nov 2016
14 Monday Nov 2016
Posted in Geo data
Tags
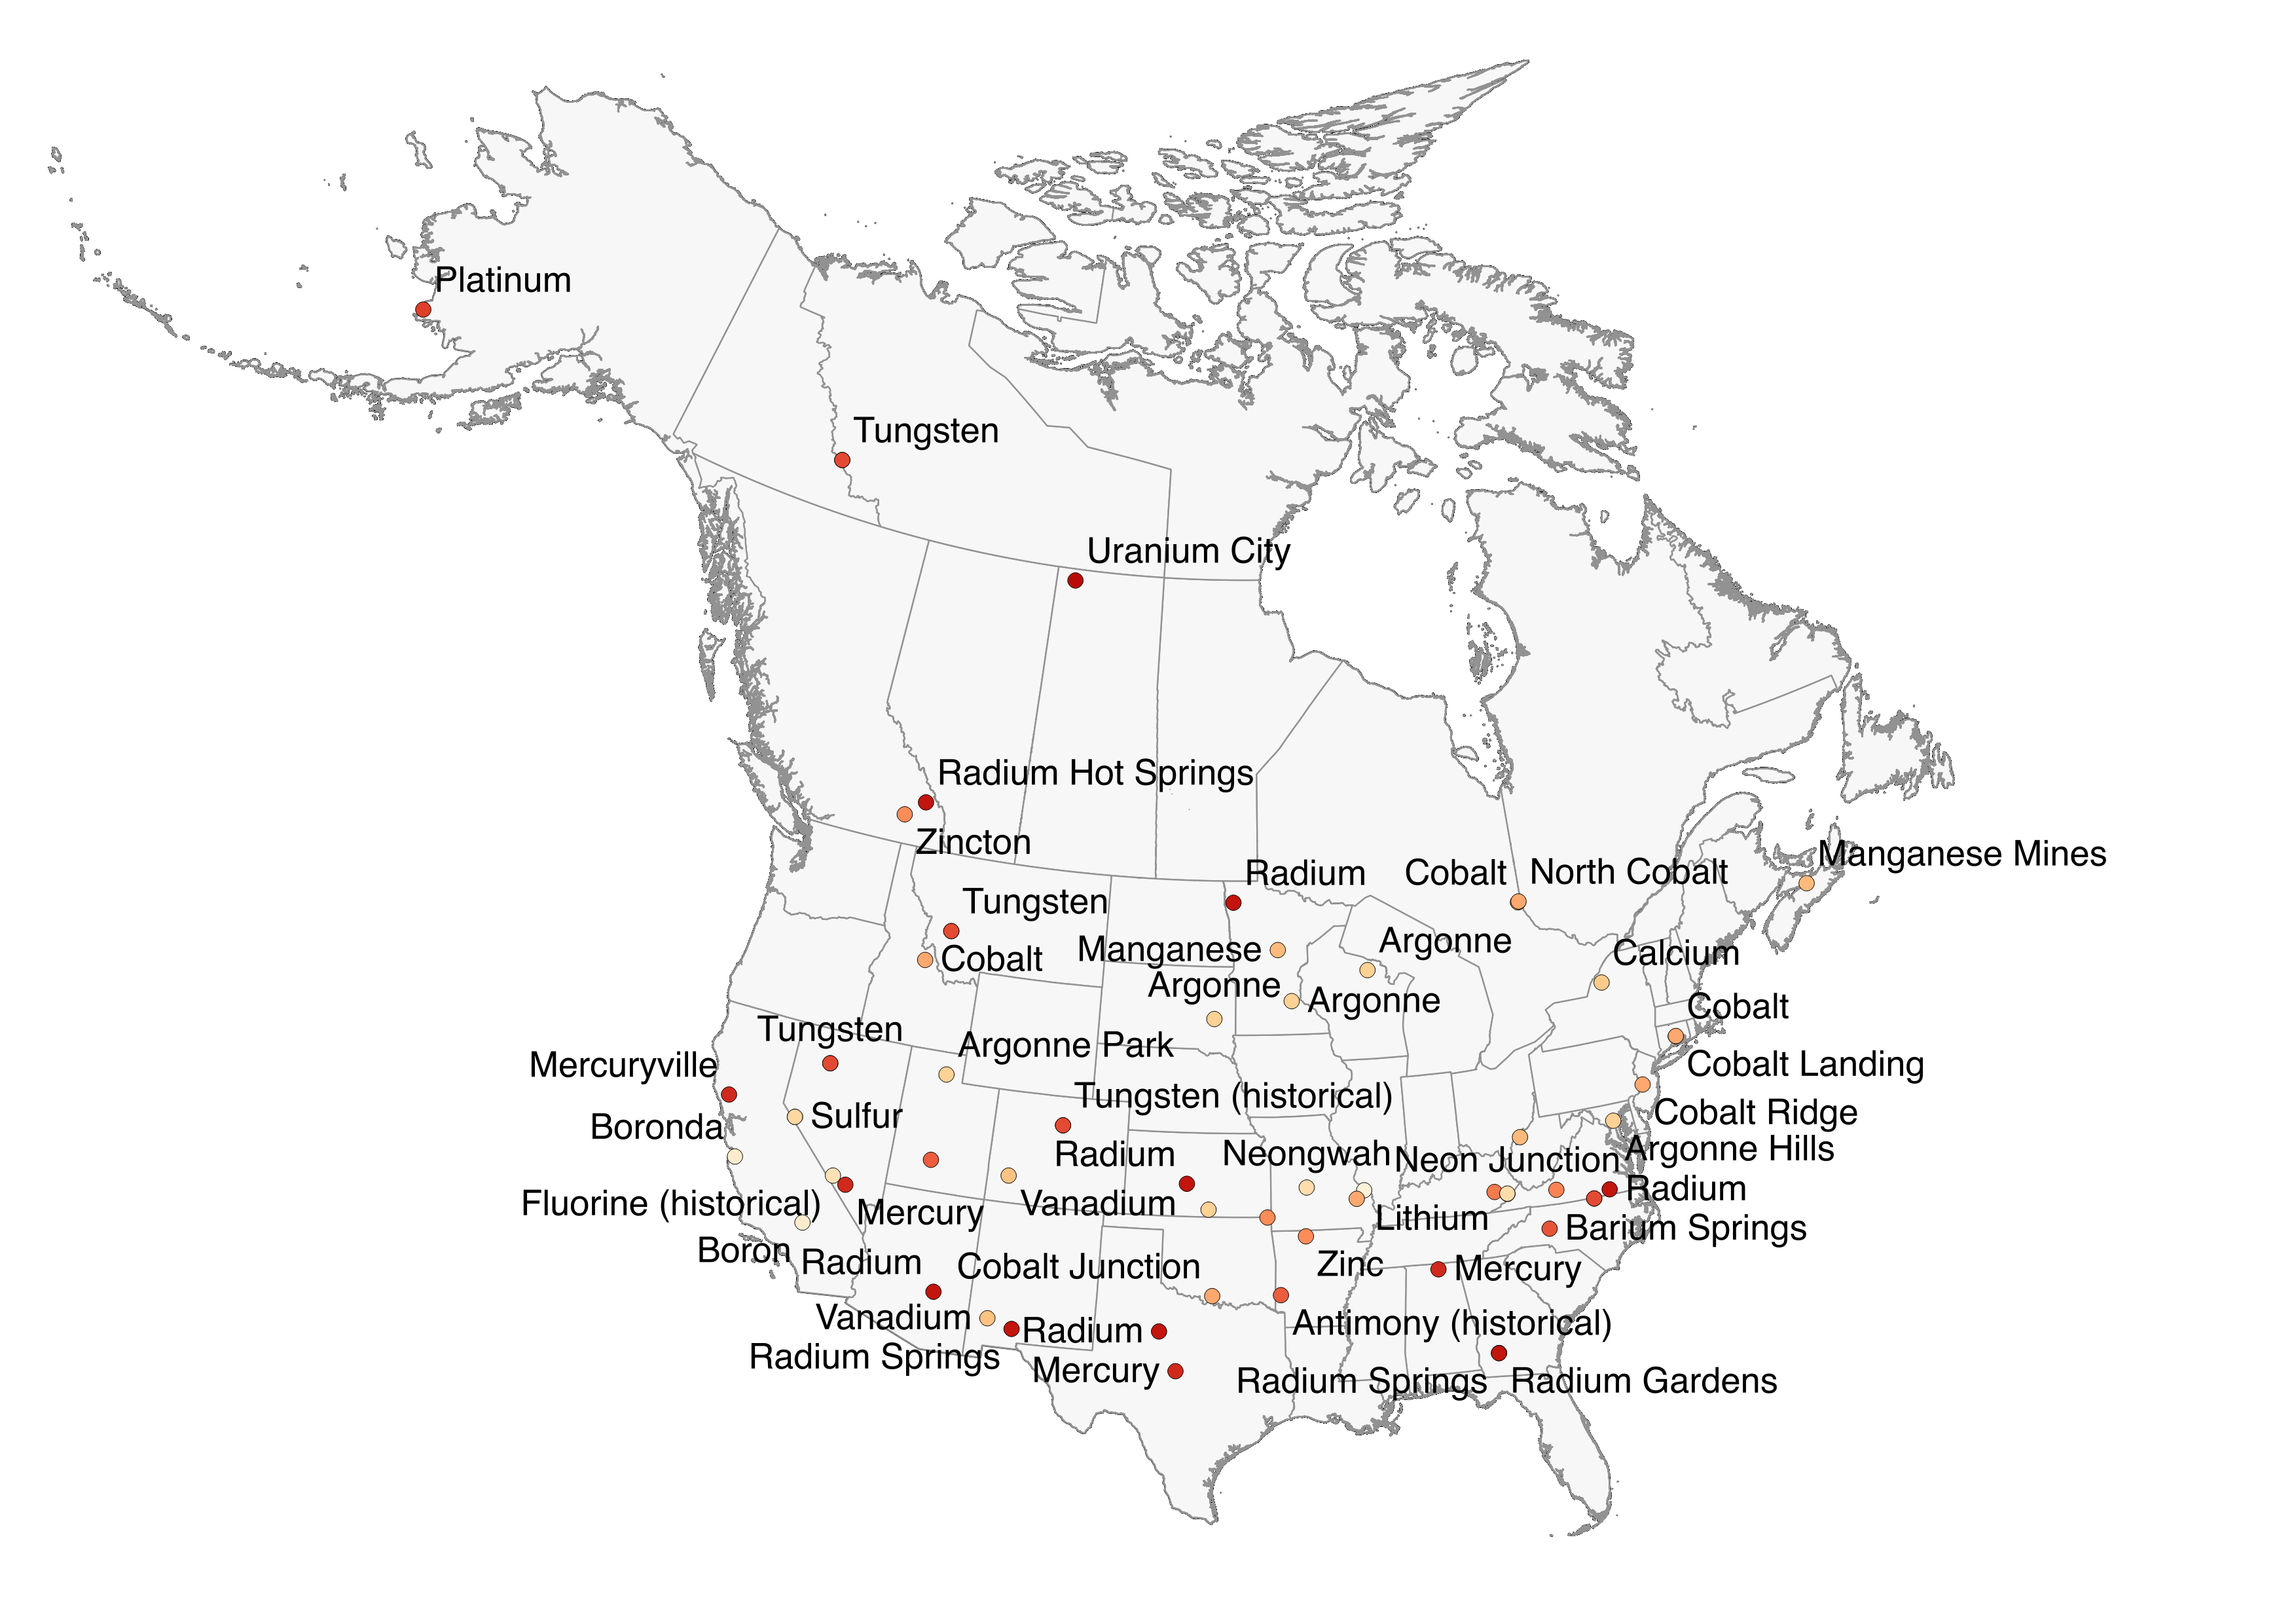
Last post we saw a map of all the towns in North America that are named after periodic elements. This post has some more detail.

All of the elemental towns in Colorado
Whilst I’m confident that the sainted Leadville was named after lead (a bi-product of the silver mining industry), I’m less confident about Leader, Carbonera and Tinaia, NM. I’ll ask a linguist.
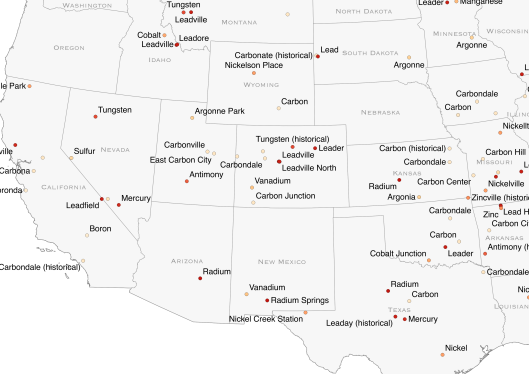
The Western States, ignoring gold, silver and copper
06 Sunday Nov 2016
Posted in Geo data, Populations
20 Monday Jun 2016
Posted in Geo data
Tags
Using successive Google timeline points, provided they are less than 10 minutes apart, I created a map of my speeds. Red tracks are slow, green are fast. Blue are really fast.


A police officer’s guide to my speeds:
06 Monday Jun 2016
Posted in Geo data
Last post we saw how our benign overlords friends at Google have been tracking my phone. Joining the dots creates tracks showing where I’ve been (shown here with and without a context map). I have only created tracks when points are less than 30 minutes apart, which means that they adhere quite well to the road network. It also explains why some of last week’s black dots have disappeared.


A stalker’s guide to my life: